On this page:
Introduction
This is the first issue of the Child Care in Australia quarterly information report under the new child care system. It presents data for the September quarter 2018 period and provides information across Child Care Usage, Availability, Fees and Entitlements in Australia including states and territories.
Key Highlights
The September quarter 2018 data shows that there were 1,316,350 children attending approved child care, including more than 50,000 Indigenous children – an increase of 3.7 per cent compared to the June quarter 2018. Close to a million families (931,030) had at least one child in approved child care, up 5.5 per cent from the June quarter 2018.
Families' use of child care also increased, with average weekly hours across all services (excluding In-Home Care) increasing to 25.7 hours, up by 8.8 per cent compared to the June quarter 2018.
The centrepiece of the new child care system is the Child Care Subsidy, which is simpler than the previous multiple payment system and is paid directly to providers. The new arrangements are designed to ensure that more financial support is targeted to the families who work the most and earn the least. In line with this, total entitlements for the September quarter were $1,948 million, representing a 25.4 per cent increase from the June quarter 2018.
In relation to fees, average hourly fees (excluding In-home care) were $9.50 in the September quarter 2018, a 2.9 per cent increase since the June quarter 2018. However, since the implementation of the Child Care Subsidy, there has been an improvement in average affordability of more than 10 per cent across the country, as measured by the Australian Bureau of Statistics Consumer Price Index.
Child Care Usage
Children
During the September quarter 2018, 1,316,350 children used approved child care in Australia. This represents a quarterly increase of 3.7 per cent (or 47,090 children) and an annual increase of 0.3 per cent (or 3,710 children). Children attending Family Day Care decreased significantly by 26.3 per cent from 178,480 children to 131,600 children over the year to the September quarter 2018. This largely reflects the impact of measures to address fraud and non-compliance in Family Day Care.
By service type, Centre Based Day Care (57.2 per cent) had the highest proportion of children followed by Outside School Hours Care (35.7 per cent) and Family Day Care (10.0 per cent). (Note that In-home care has been excluded from all state and service type analyses and child care usage analyses due to privacy considerations.)
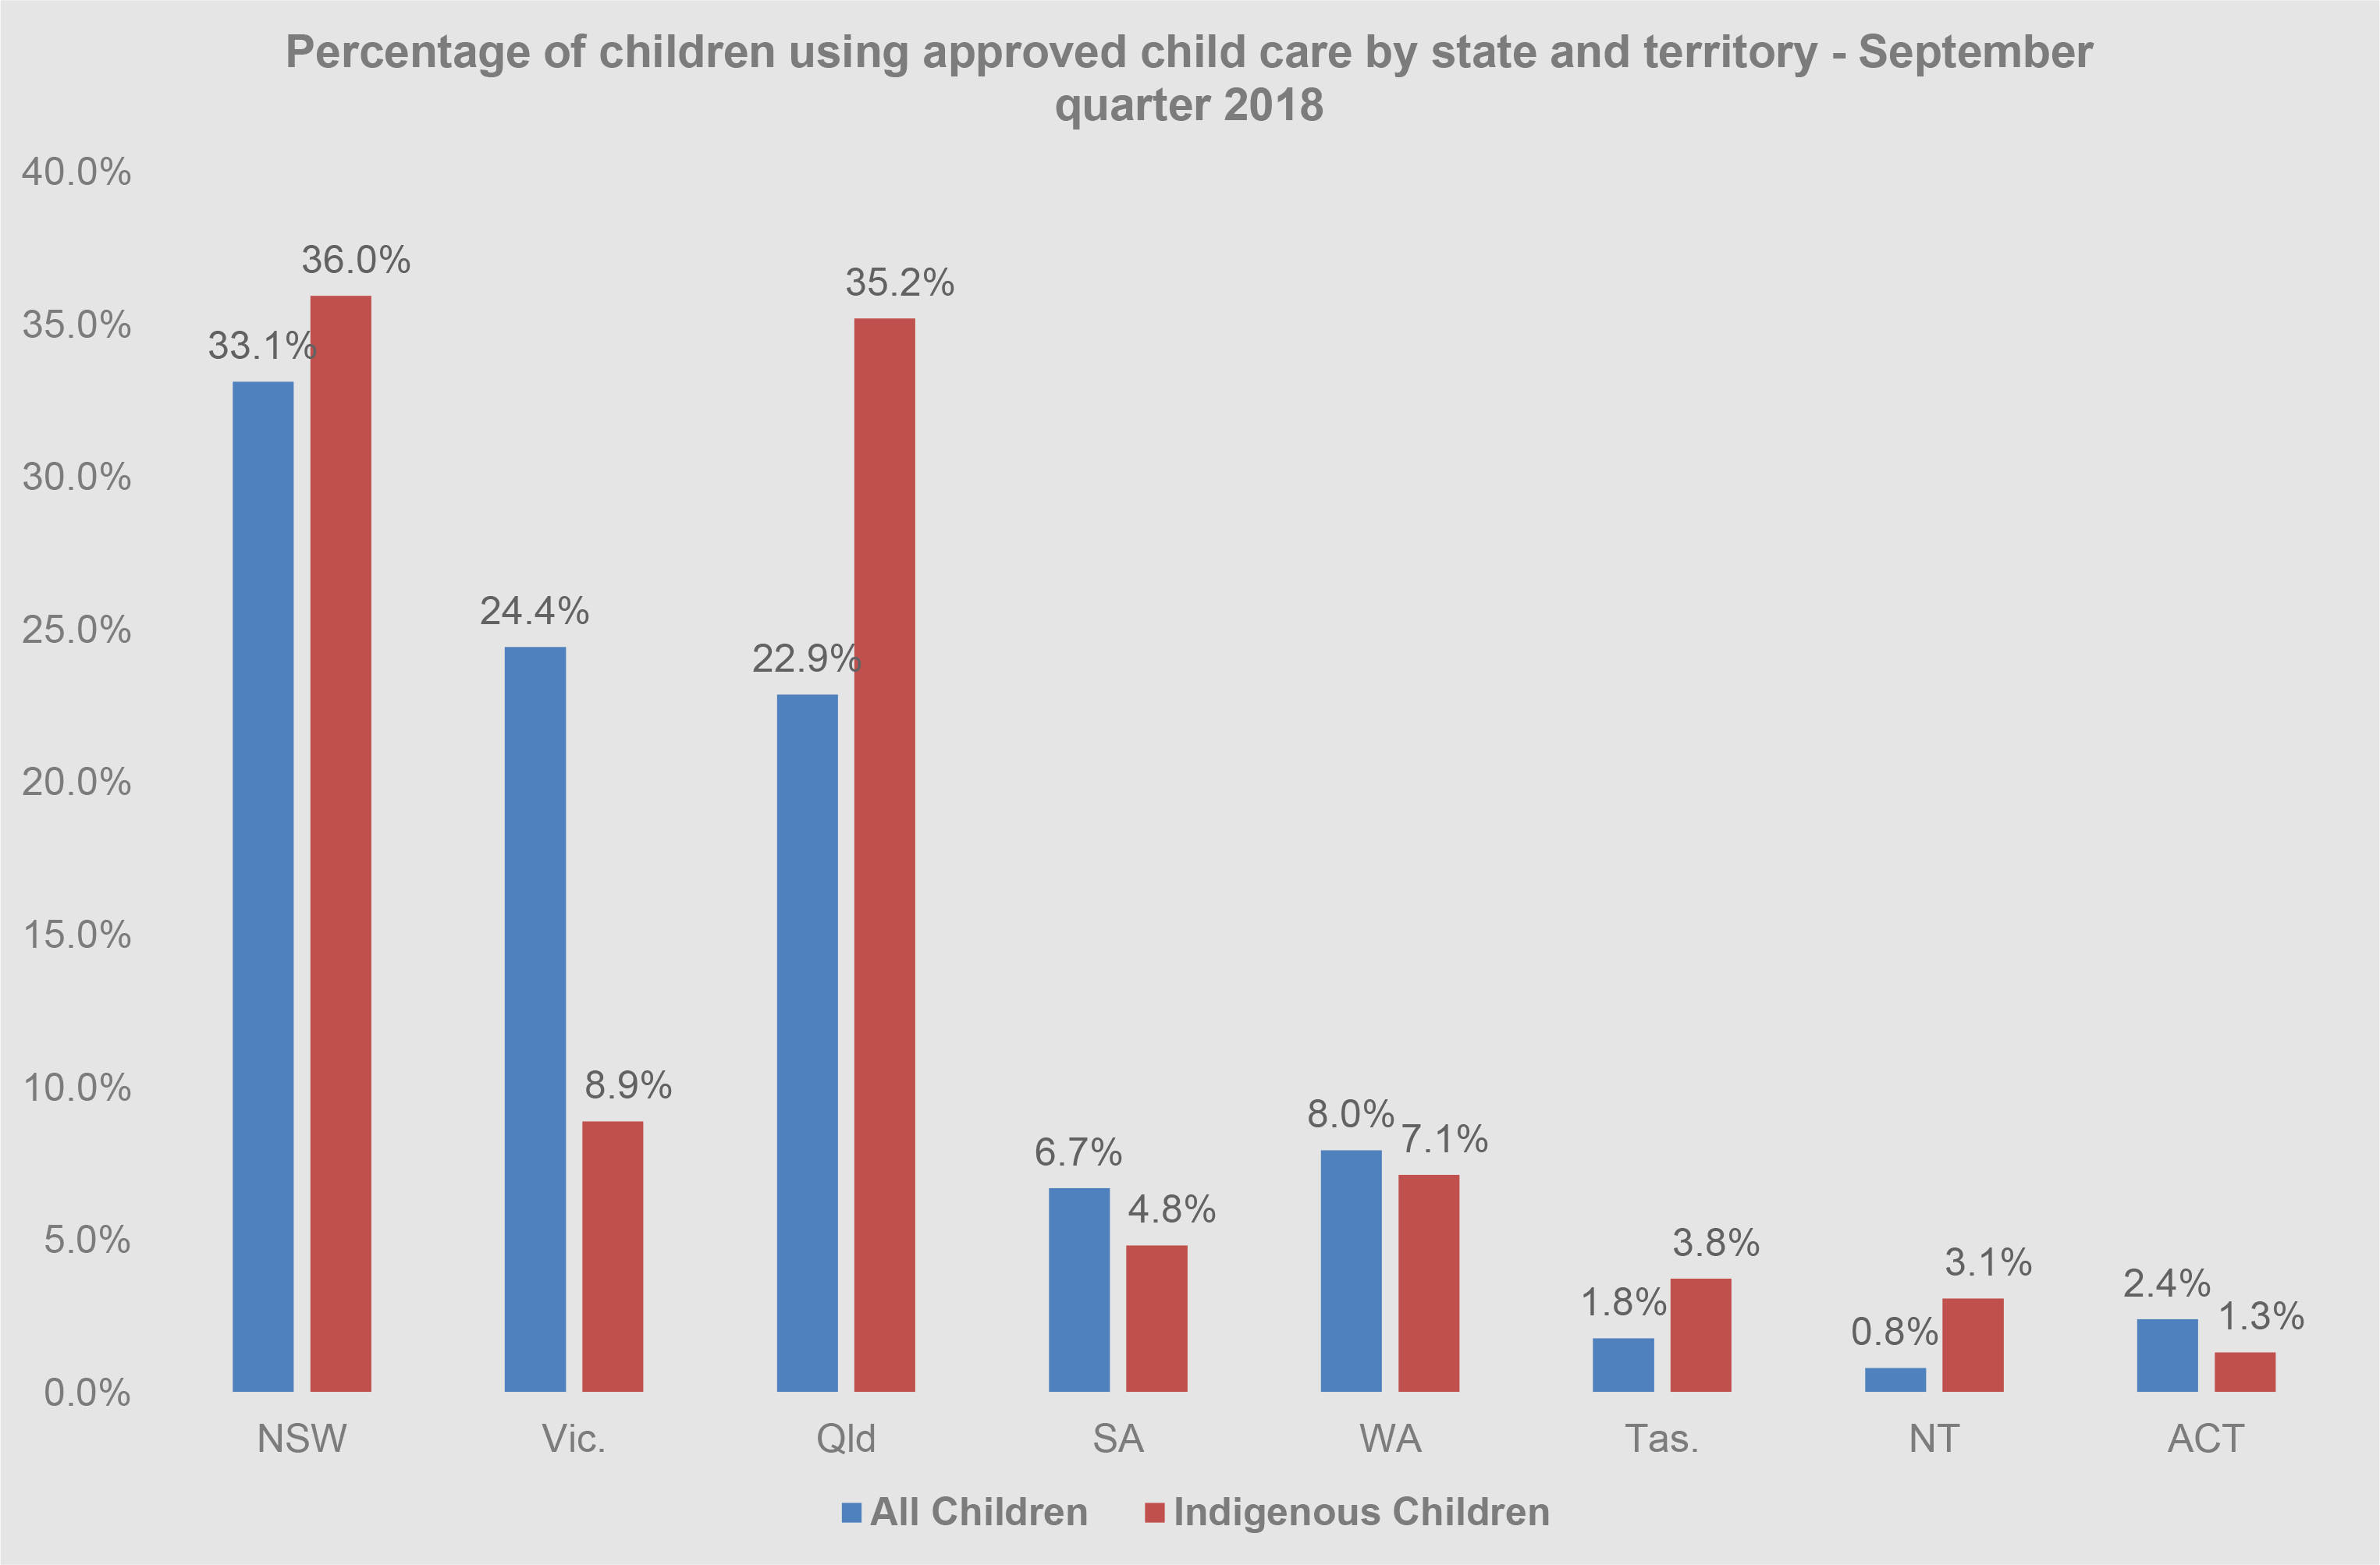
By state, New South Wales had the largest share of children attending approved child care (33.1 per cent), followed by Victoria (24.4 per cent) and Queensland (22.9 per cent). During the quarter, New South Wales also had the largest share of Indigenous children attending approved child care (36.0 per cent), followed by Queensland (35.2 per cent).
| State and Territory | Percentage of children using approved child care by state and territory | Percentage of Indigenous children using approved child care by state and territory |
|---|---|---|
| NSW | 33.1% | 36.0% |
| Vic. | 24.4% | 8.9% |
| Qld | 22.9% | 35.2% |
| SA | 6.7% | 4.8% |
| WA | 8.0% | 7.1% |
| Tas. | 1.8% | 3.8% |
| NT | 0.8% | 3.1% |
| ACT | 2.4% | 1.3% |
Note: In-home care has been excluded from these percentage calculations due to privacy considerations.
Indigenous children
During the September quarter 2018, 50,210 Indigenous children used approved child care in Australia. This is a large increase compared to previously published numbers and largely reflects Budget Based Funded services being incorporated in mainstream child care and changes to the way Indigenous children are defined. (Please see technical notes.)
By state, New South Wales had largest share of Indigenous children attending approved child care (36.0 per cent), followed by Queensland (35.2 per cent) and Victoria (8.9 per cent). (In-home care has been excluded from these percentage calculations due to privacy considerations.)
In addition, a significant proportion of Indigenous children attended Centre Based Day Care (66.9 per cent). This compares with 57.2 per cent for all children in child care. More than a quarter of indigenous children (26.8 per cent) attended Outside School Hours Care while 9.0 per cent of all Indigenous children attended Family Day Care. (Please note: these numbers add to more than 100 per cent as some children attend more than one care type).
Families
During the September quarter 2018, there were 931,030 families accessing child care. This represents a 5.5 per cent (or 48,480 families) increase from the previous quarter and a 3.3 per cent increase (or 29,390) in annual terms. The number of families accessing Family Day Care decreased by 19.5 per cent from 110,740 in the September quarter 2017 to 89,160 in the September quarter 2018. This again was due to the compliance measures implemented.
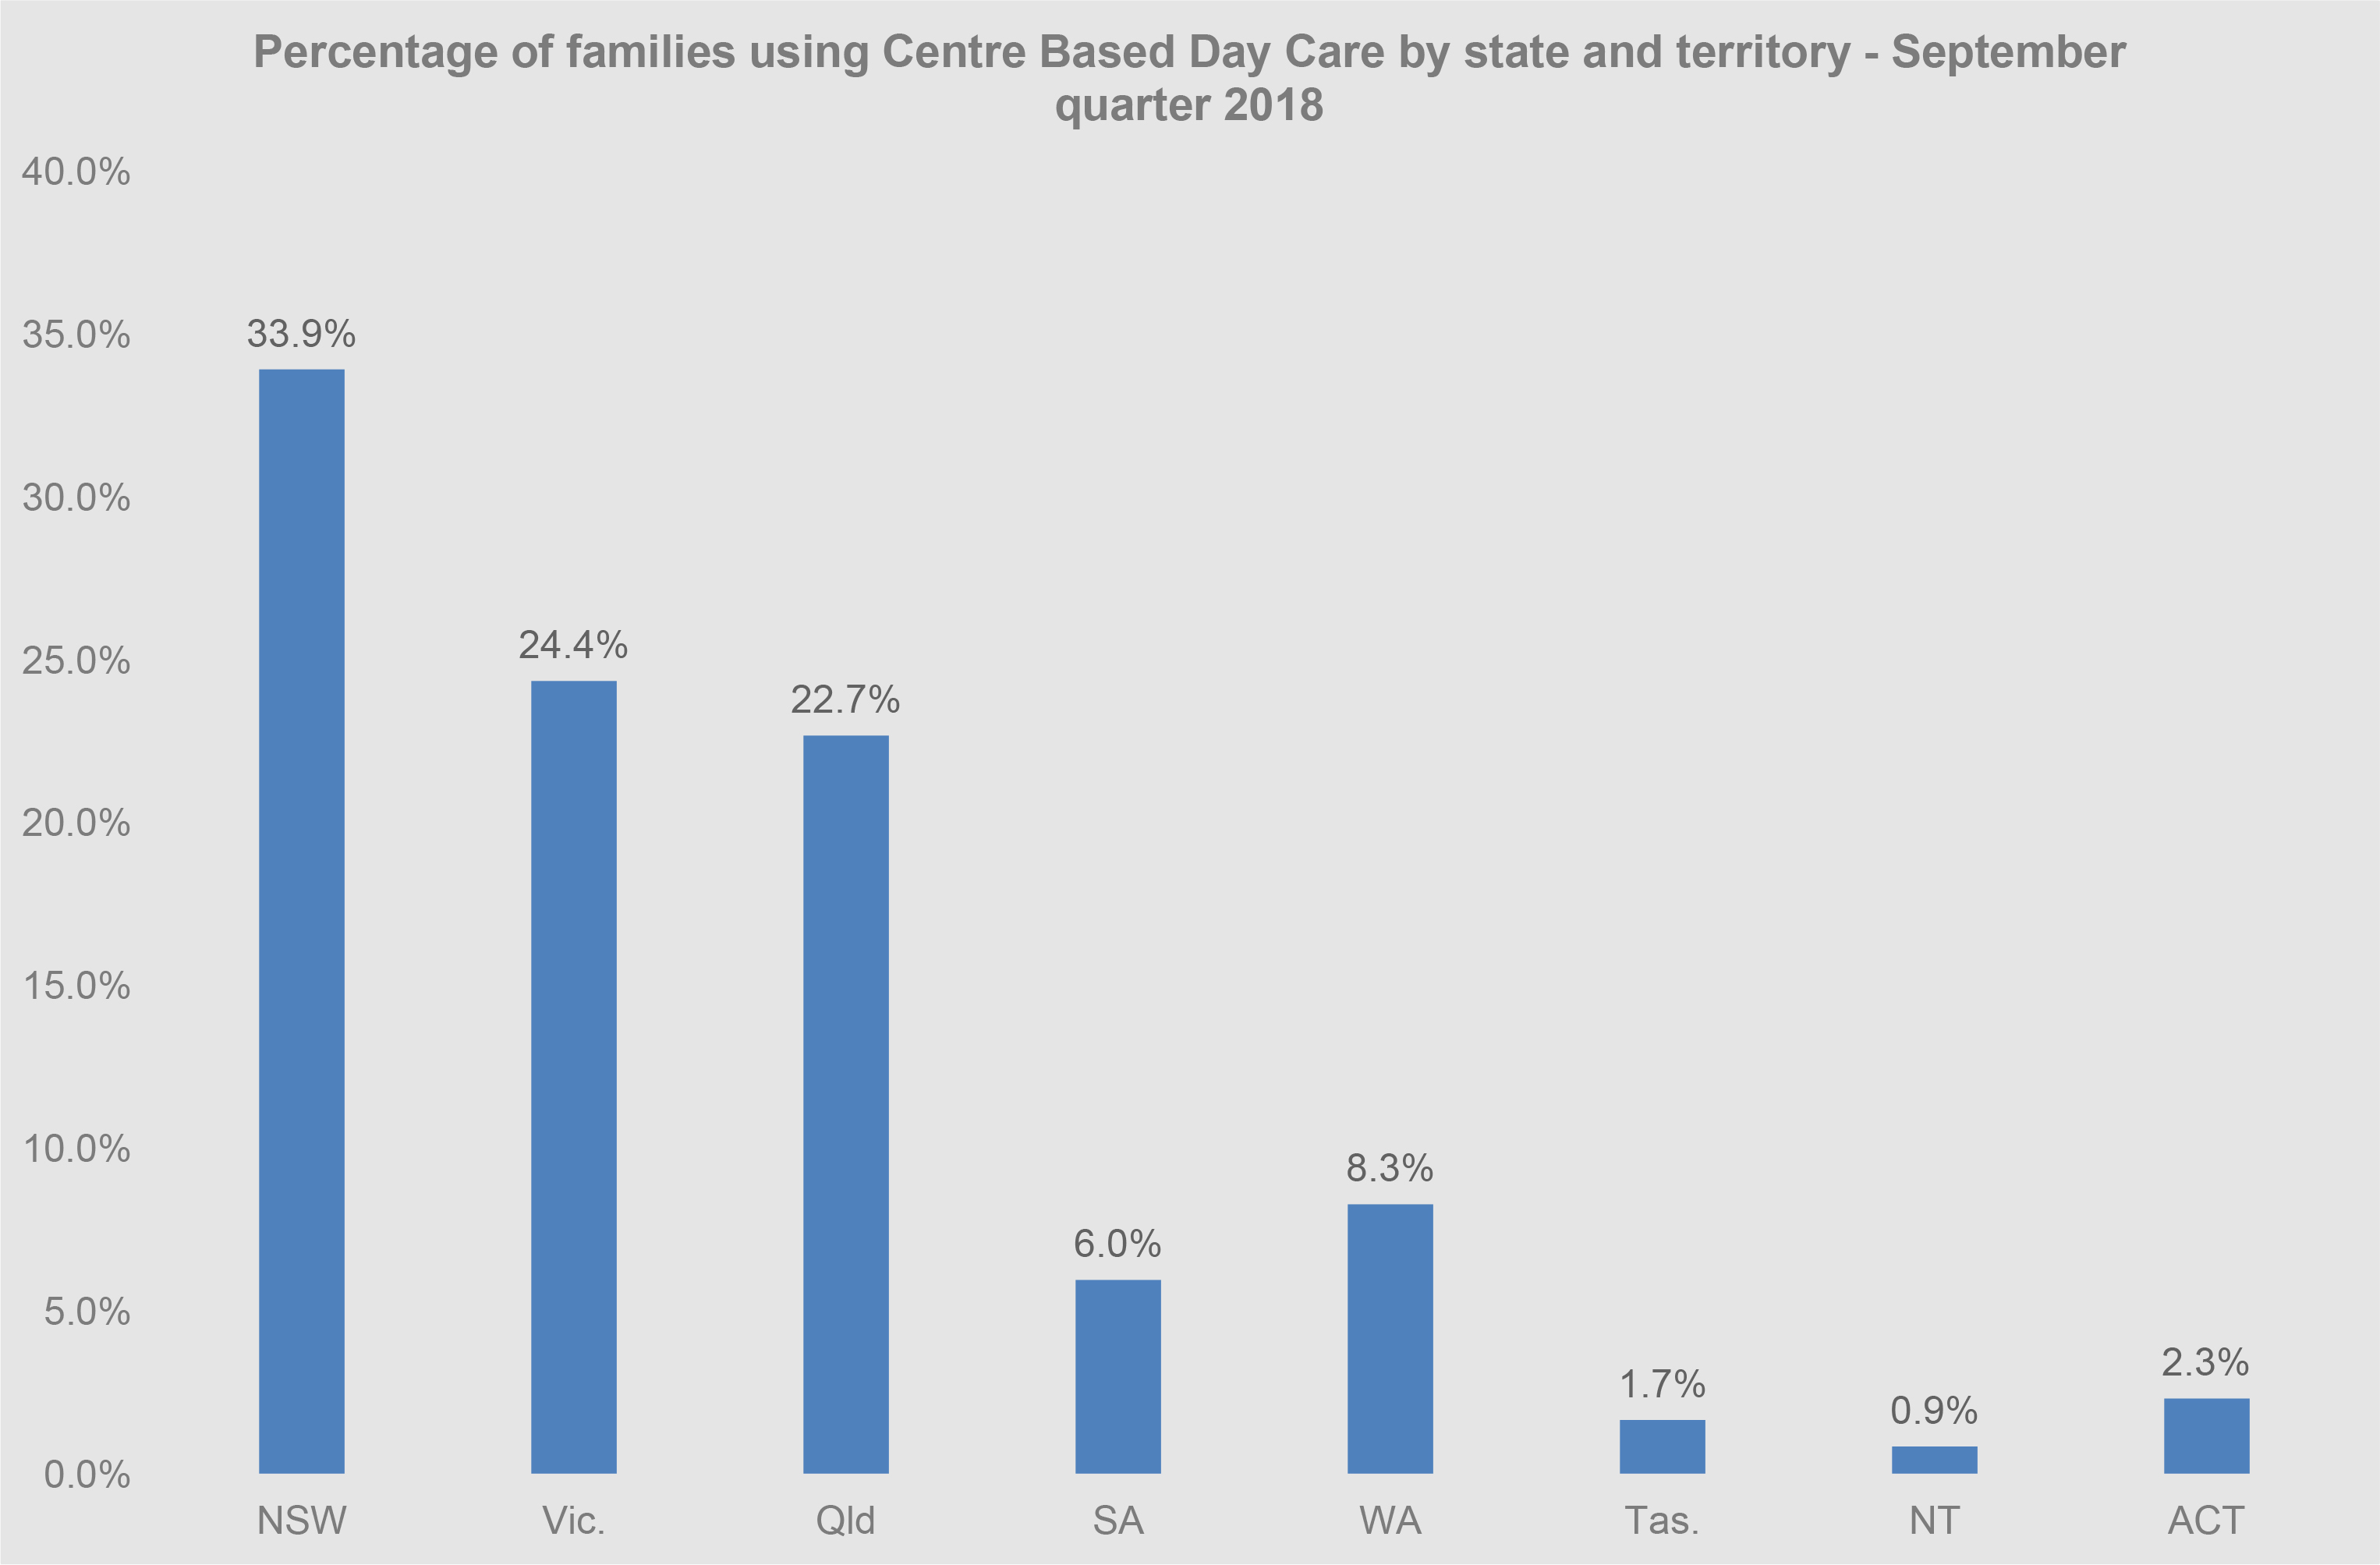
In relation to families in Centre Based Day Care by state, New South Wales had the largest share of families attending (33.5 per cent), followed by Victoria (24.5per cent) and Queensland (22.5 per cent).
| State and territory | Percentage of families using Centre Based Day Care by state and territory |
|---|---|
| NSW | 33.9% |
| Vic. | 24.4% |
| Qld | 22.7% |
| SA | 6.0% |
| WA | 8.3% |
| Tas. | 1.7% |
| NT | 0.9% |
| ACT | 2.3% |
Average weekly hours
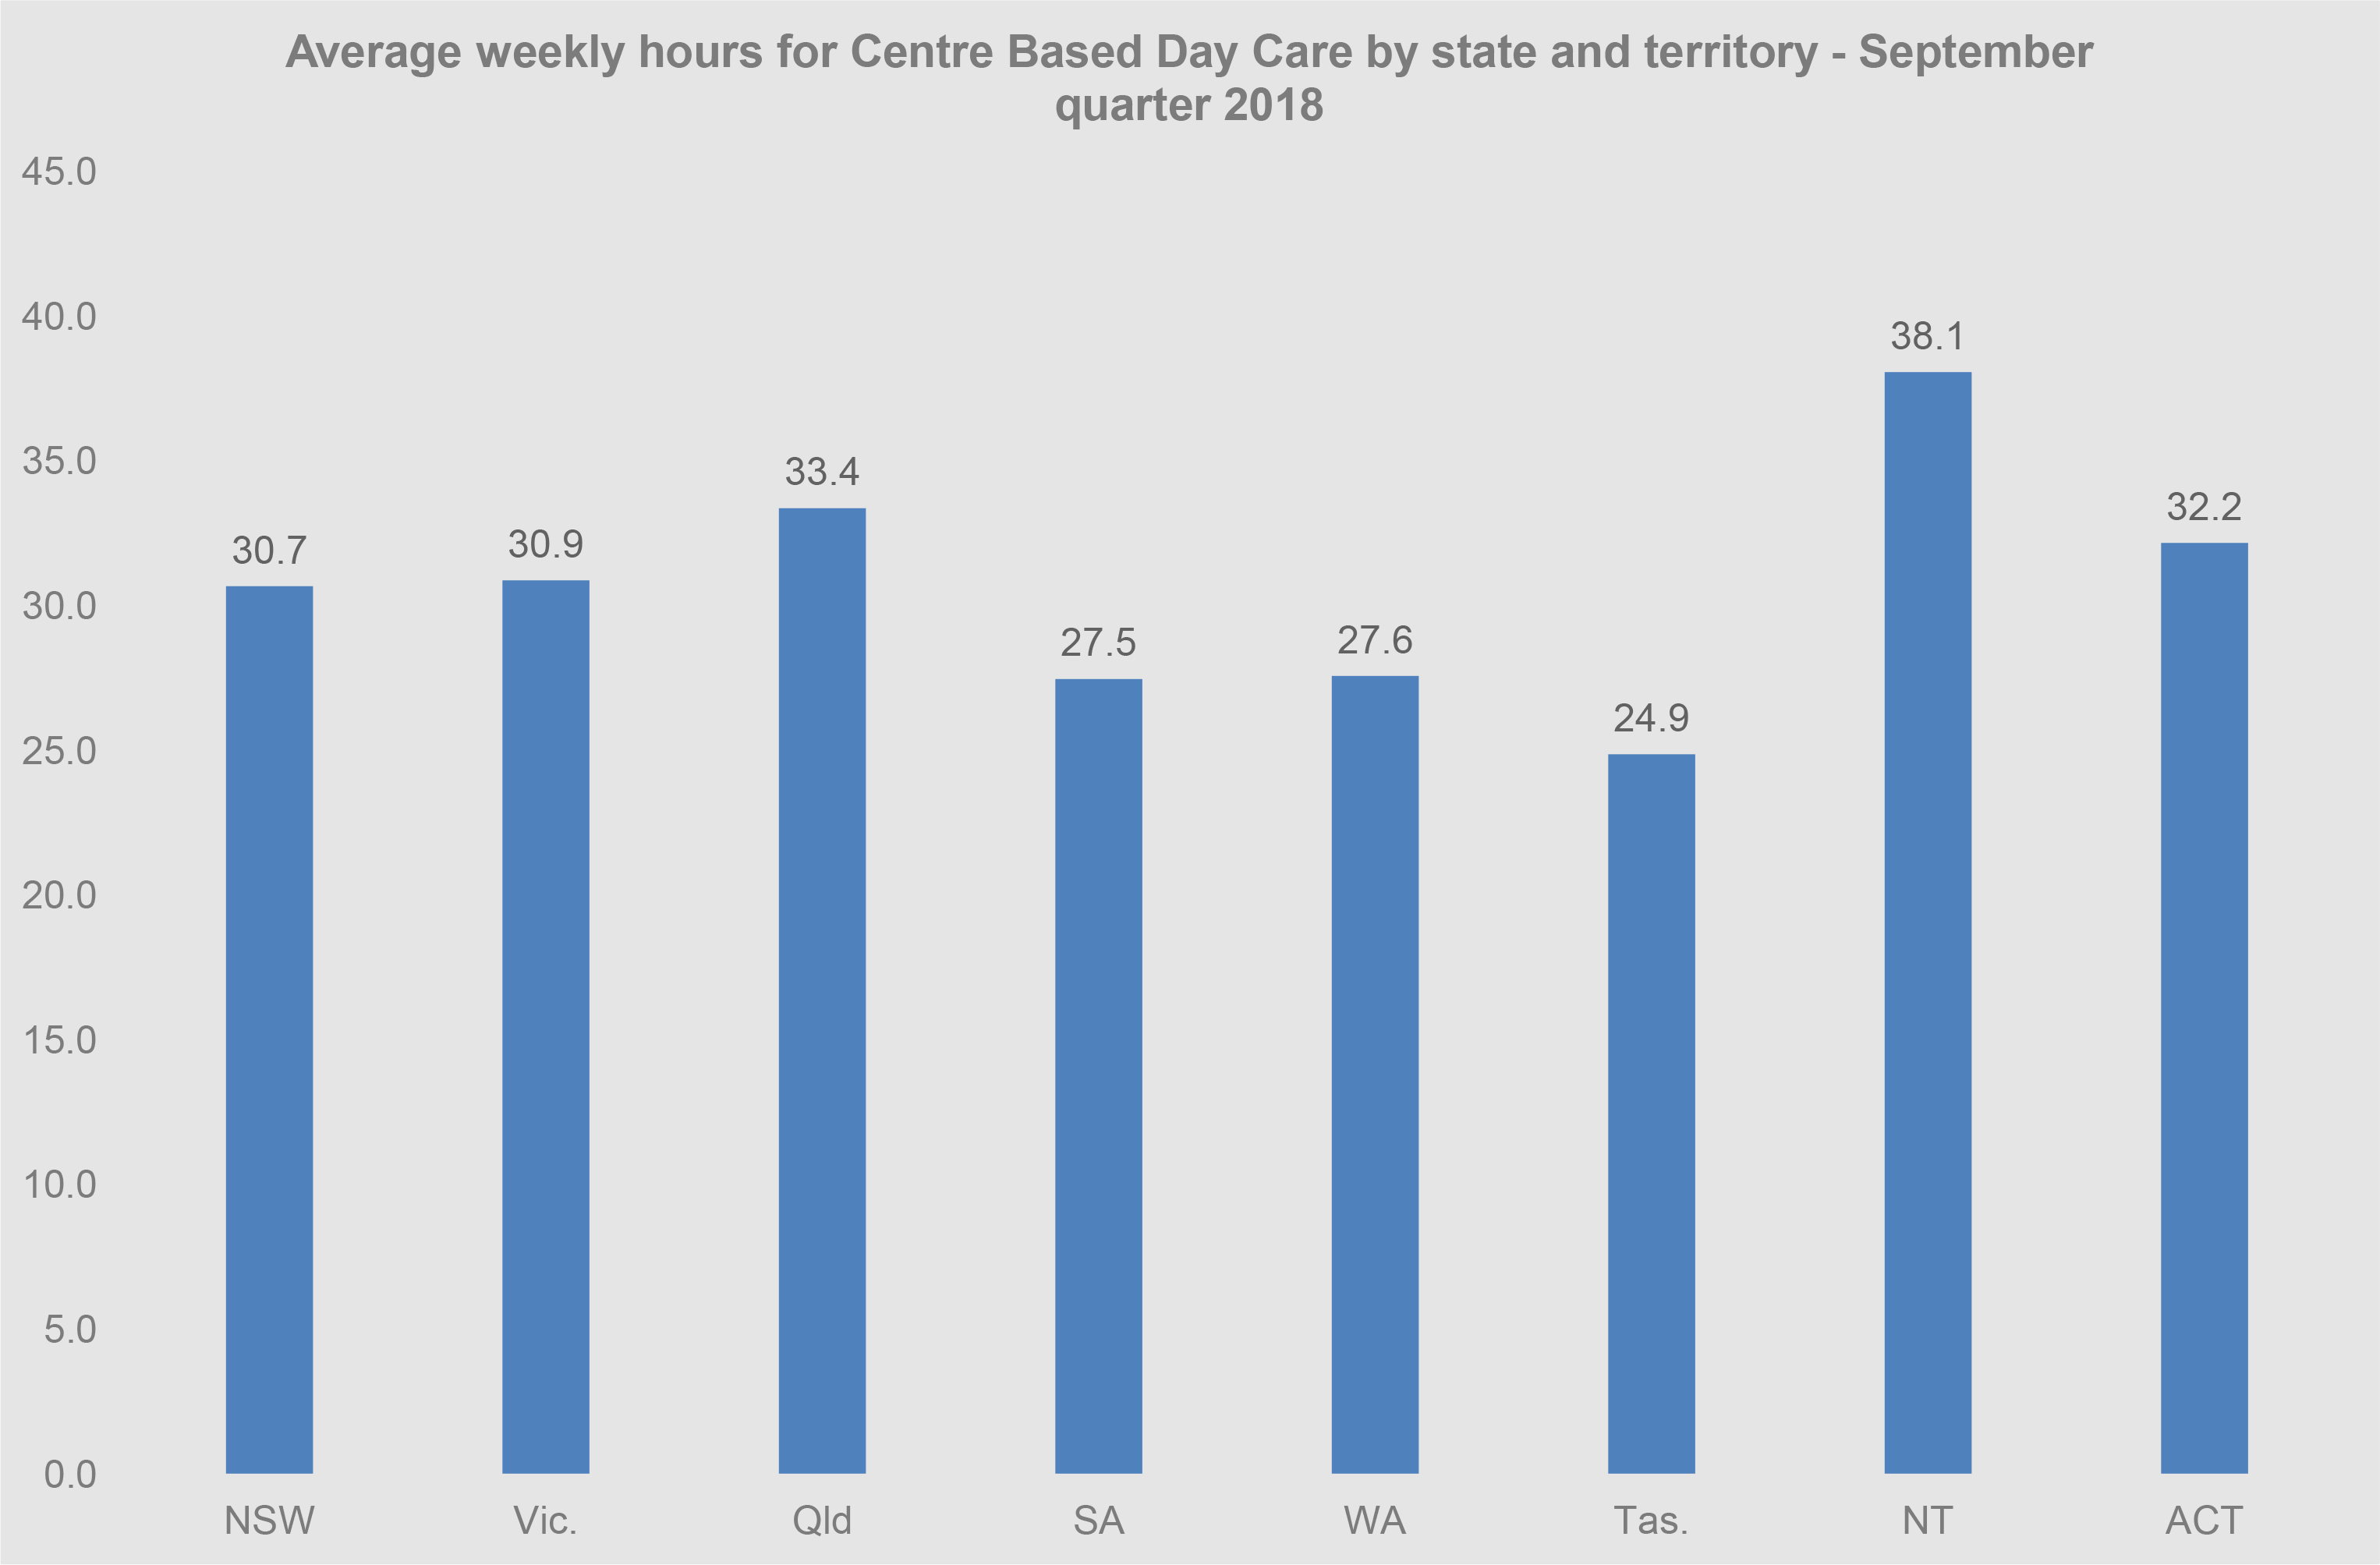
The average weekly hours per child (excluding In Home Care) across Australia was 25.7 hours. This represents an 8.8 per cent increase compared to the June quarter 2018 (23.6 hours) and a 3.7 per cent increase compared to the September quarter 2017 (24.8 hours). During the September quarter 2018, the average weekly hours per child for Centre Based Day Care was 30.9 hours per week.
In relation to Centre Based Day Care by state, Northern Territory had the highest average weekly hours (38.1 hours), followed by the Queensland (33.4 hours) and the Australian Capital Territory (32.2 hours). Tasmania had the lowest average weekly hours (24.9 hours).
Availability
Services
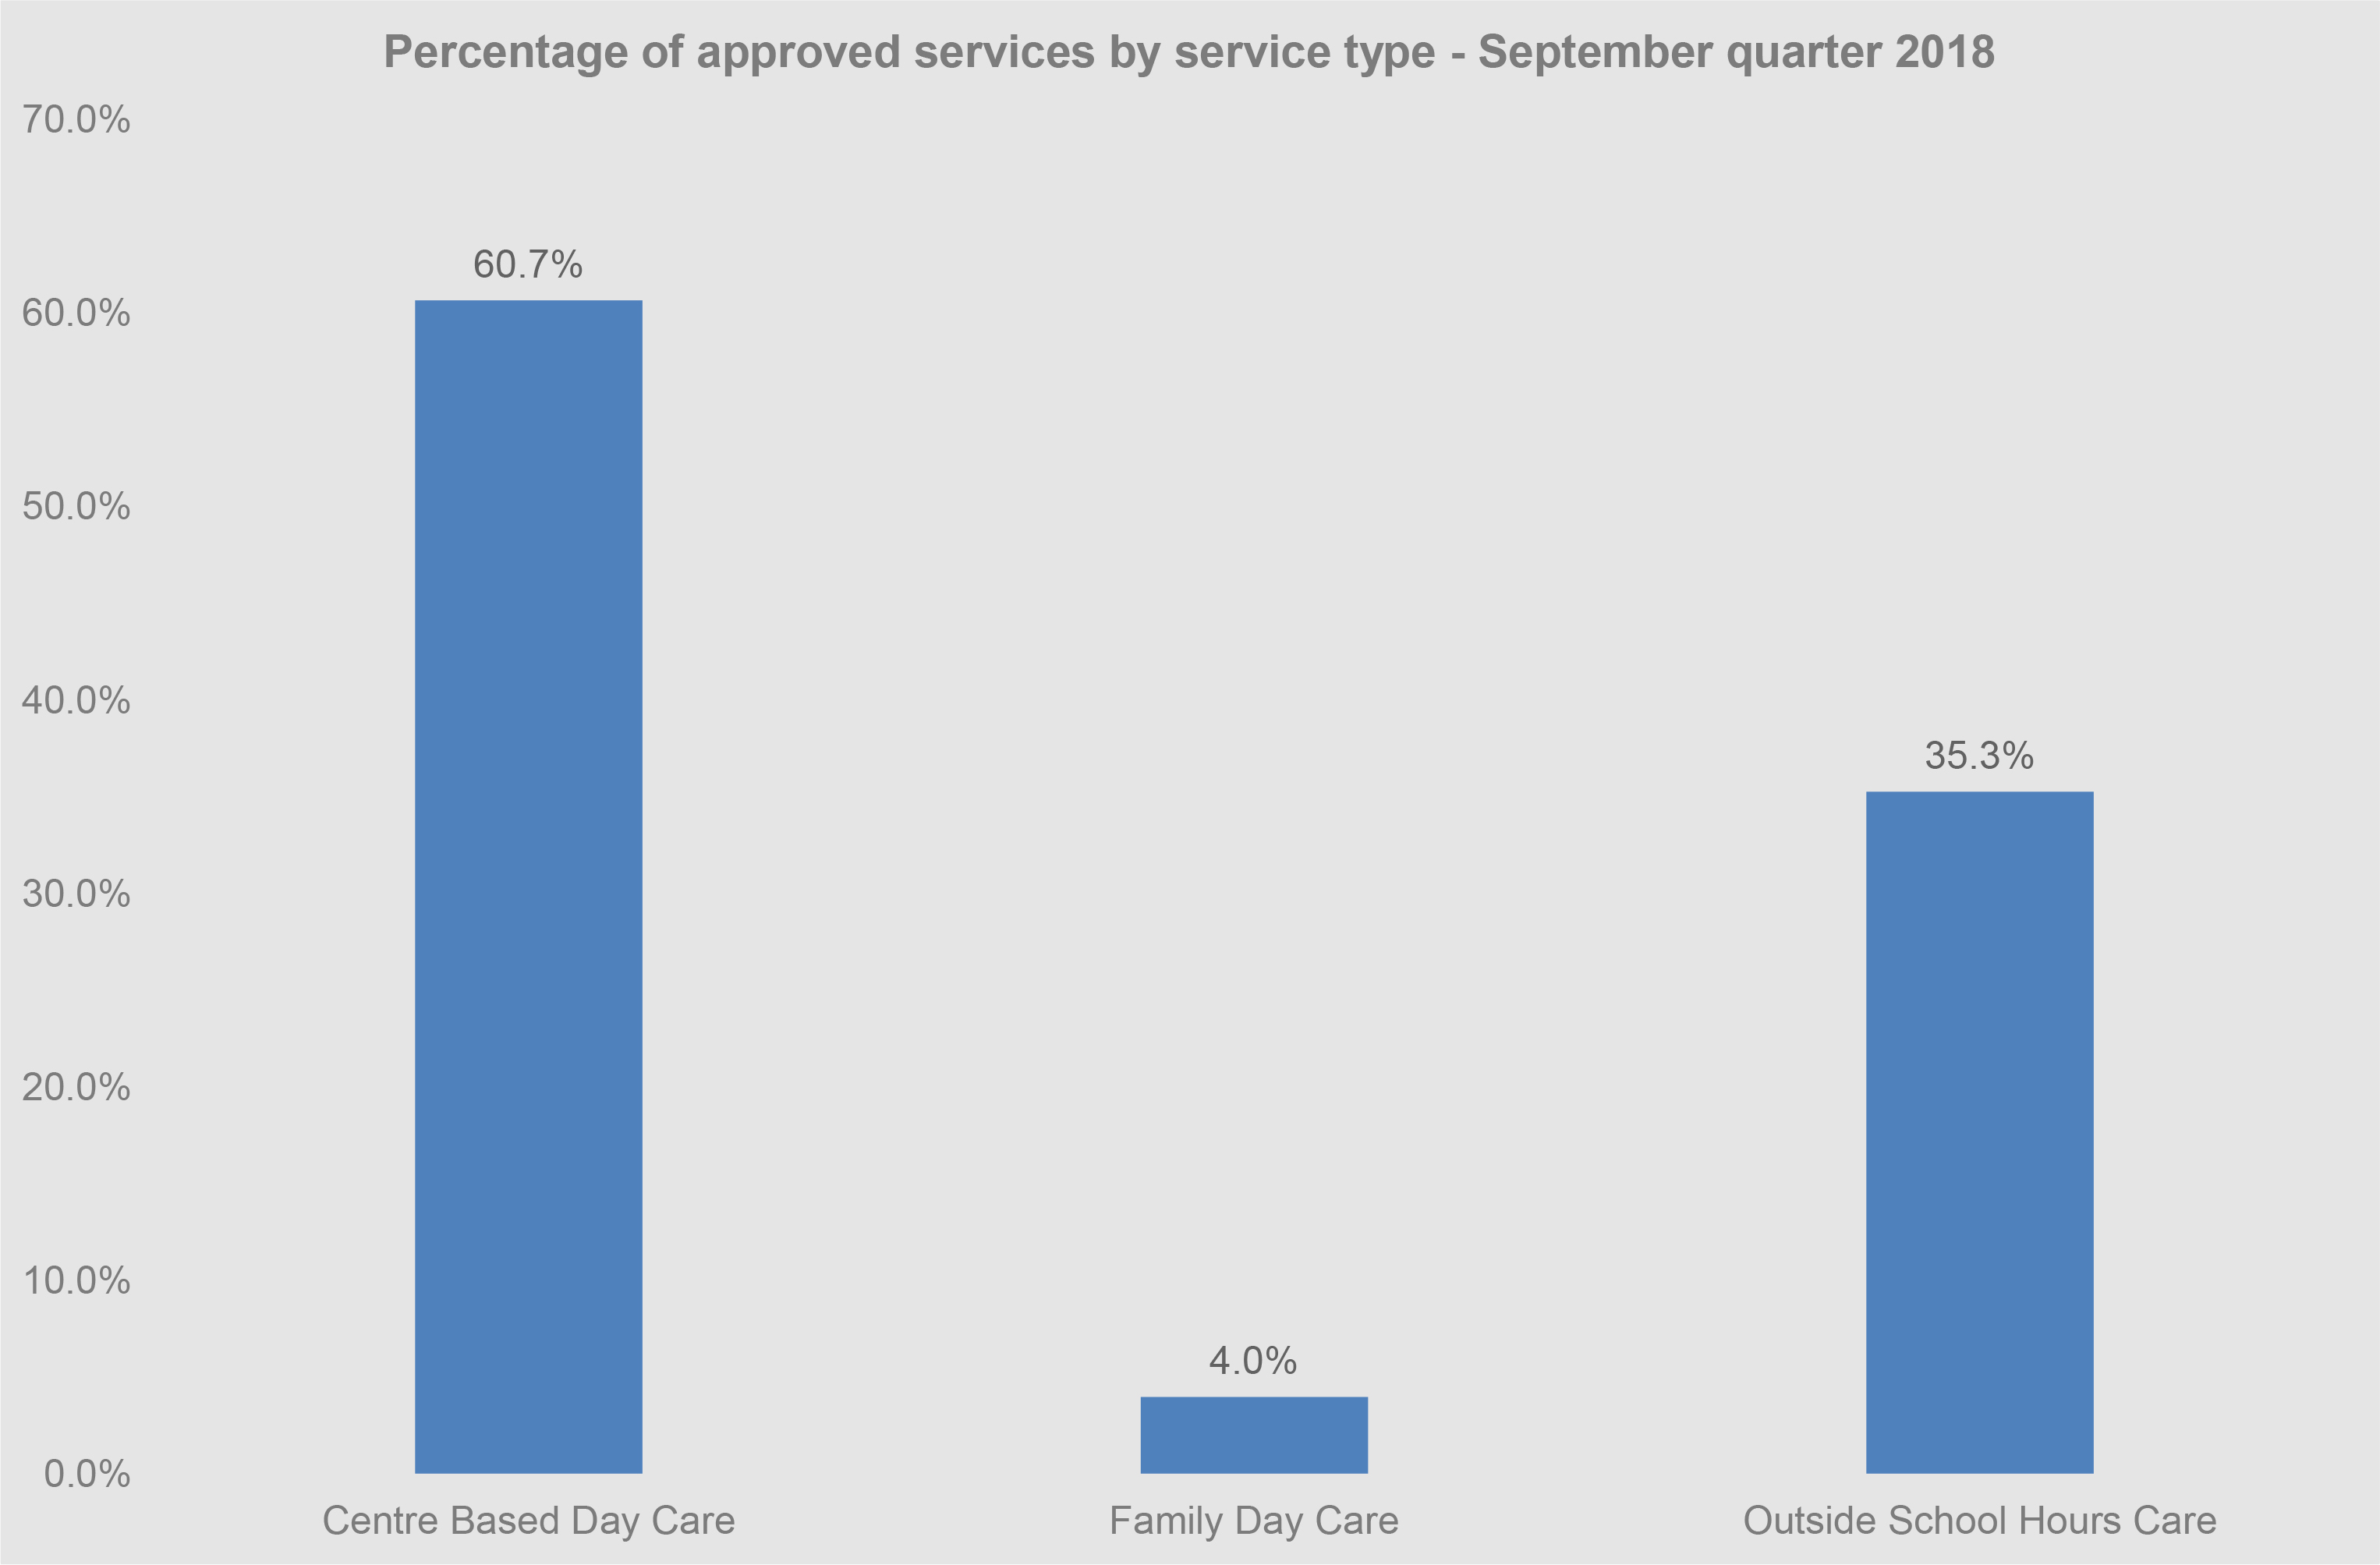
During the September quarter 2018, 12,853 approved child care services operated in Australia. There were 7,765 Centre-Based Day Care services, which accounted for 60.7 per cent of all services and 4,517 Outside School Hours Care services, which accounted for 35.3 per cent of all services. Family Day Care comprised 4.0 per cent of all services. Nationally, there were 56 In-home Care services.
| Service type | Percentage of approved services by service type |
| Centre Based Day Care | 60.7% |
| Family Day Care | 4.0% |
| Outside School Hours Care | 35.3% |
Note: In-home care has been excluded from these percentage calculations due to privacy considerations.
Fees
Cost of care before Australian Government fee assistance
During the September quarter 2018, the average hourly child care fee for all service types (excluding In Home Care) was $9.50. This represents a 2.9 per cent increase from $9.20 in the June quarter 2018 and a 5.8 per cent increase from in the September quarter 2017 ($8.95). The annual fee growth of 5.8 per cent was in line with the 10-year long-term growth average (5.8 per cent).
Across care types, Outside School Hours Care had the lowest average hourly fee ($7.50 per hour) while Family Day Care ($10.05 per hour) had the highest. Average hourly fees for Centre based Day Care was $9.80.
| Service type | Average hourly fee by service type |
|---|---|
| Centre Based Day Care | $9.80 |
| Family Day Care | $10.05 |
| Outside School Hours Care | $7.50 |
| Total | $9.50 |
Note: In-home care has been excluded from these percentage calculations due to privacy considerations.
Total Entitlements
Total estimated expenditure
The total estimated expenditure (Child Care Subsidy and Additional Child Care Subsidy) during the quarter was $1,948.6 million up by 25.4 per cent since the June quarter 2018 ($1,554 million) and by 2.2 per cent over the year to the September quarter 2017 ($1,907.5).
The majority of entitlements were paid in relation to families using Centre Based Day Care services ($1,527.7 million or 78.7 per cent). Family Day Care comprised 11.6 per cent of total entitlements in the September quarter 2018 but declined by 9.4 per cent in the June quarter 2018 and by 33.3 per cent since the September quarter 2017.
| Service type | Percentage of Entitlements by service type |
|---|---|
| Centre Based Day Care | 78.7% |
| Family Day Care | 11.6% |
| Outside School Hours Care | 9.8% |
Note: In-home care has been excluded from these percentage calculations due to privacy considerations.
Additional Information
Technical Notes
The introduction of the new child care package on 2 July 2018 changed major components of the child care system resulting in a break in series for some child care metrics. Points to note include:
- The population of children that are included in child care data reports from 2 July 2018 onwards covers those children who have been allocated a Customer Reference Number (CRN) by Centrelink.
- Changes to child care service approvals and service types has resulted in a reduced number of service approvals. For example, prior to 2 July 2018, a provider delivering vacation care, before school care and after school care would have been counted in child care data as three different services rather than the one Outside School Hours Care service as is the case from 2 July 2018 onwards. Accordingly, it is typically not possible to compare the number of services before and after the introduction of the new child care system.
- Prior to July 2018, approved child care types included Long day care (LDC), Family day care (FDC), In home care (IHC), Occasional care (OCC), Before school care (BSC), After school care (ASC) and Vacation care (VAC) (with BSC, ASC and VAC aggregated to form Outside School Hours Care). From 2 July 2018 onwards, approved child care types are Centre Based Day Care, Family Day Care, In Home Care and Outside School Hours Care. Only Family Day Care and In Home Care remain unchanged to compare service counts over time. Comparisons using pseudo service types may be undertaken to make broad comparisons (children, families, services) across the two child care systems by service type e.g. Combining LDC and OCC may provide a pseudo comparison group for Centre Based Long Day services in some instances with appropriate caveats.
- In Home Care subsidies became family based on 2 July 2018 and prior to this date they were child based. For this reason In Home Care is excluded from some tables in this report that are child based metrics (e.g. average hourly fee per child, average hours per week per child etc).
- Many services that were Budget Based Funded services prior to July 2018 have now been included in mainstream child care within Centre Based Day Care services.
- Due to the inclusion of many of the Budget Based Funded services into mainstream child care, the number of Indigenous children and families has increased compared to the counts under the previous child care system. In addition, changes have been made to the way Indigenous children and families are defined. Previously children associated with an Indigenous customer were counted as Indigenous, however, children are now also counted as Indigenous if the customer's partner is Indigenous. Similarly, Indigenous families are now counted when either the customer or the customer's partner is Indigenous. Previously, only customers who were Indigenous were counted as Indigenous families.
General counting rules
All analysis broken down by state in this report corresponds to the state of the service rather than the state where the child/family lives.
Use of child care services is counted for each individual child, who has been allocated a Customer Reference Number by the Department of Human Services (DHS), using approved child care services. An instance of child care usage is defined as at least one child care attendance per child care service for the quarter irrespective of duration or frequency. For example, a single hour at an In Home Care service or 40 hours per week throughout the quarter at a Centre Based Day Care, are both counted as an instance of child care usage.
Children and families are recorded for each of the service types that they use during the quarter. Children and families using more than one service type during the quarter or financial year are counted only once within each applicable service type category and only once within the 'Total' category for the relevant time period. Note that as children and families may use more than one service type in any particular timeframe the sum of the component parts may not equal the 'Total' category.
With the introduction of the new child care system, on 2 July 2018, counts of approved child care services reflect the number of services operating the four types of approved care; Centre Based Day Care; Family Day Care In Home Care; and Outside School Hours Care. A service is counted as 'active' only if it had at least one child attending at some time during the quarter, thus aligning the counting rules for children, families and services.
Child Care Subsidy estimation
The Child Care Subsidy (CCS) estimation method used in this report:
- CCS is likely to be under-estimated as only CCS payments made during the quarter are reported and not the amounts customers were actually entitled to but did not receive (for example because of families over-estimating income to avoid debts).
- Doesn't take into account reconciliation which will adjust the customers' CCS actual entitlements based on their actual rather than estimated incomes. There is a considerable time lag for the reconciliation process to be complete.
Data sources
Data included in this report comes from the following sources:
- The data is extracted from the Department of Human Services Enterprise Data Warehouse.
Revisions: Due to changes in the administrative system, data may be revised to ensure the most accurate, up-to-date figures are published.
Definitions
Additional Child Care Subsidy: A payment that provides targeted additional fee assistance to families and children facing barriers in accessing affordable child care.
Approved care: Care provided by Centre Based Day Care, Family Day Care, In Home Care and Outside School Hours Care services approved by the Australian Government to receive Child Care Subsidy on behalf of families.
Child Care Subsidy (CCS): A payment made by the Australian Government to families to assist with the cost of child care.
Child Care Subsidy System (CCSS): The technical platform through which providers and families interact with government in relation to child care subsidies.
Customer Reference Number (CRN): An individual reference number allocated by Centrelink for each child and one for each parent or guardian who is claiming Child Care Subsidy.
Family Day Care: A type of child care that is usually provided in the home of an educator.
In-Home Care: A flexible form of early childhood education and care where an educator provides care in the child's home. It is restricted to families who are unable to access other forms of early childhood education.
Centre Based Day Care: Child care that is provided in licenced or registered centres. It can include any pattern or arranged of care provided in this setting.
Outside School Hours Care: Outside School Hours Care provides care before and after school hours and during school vacations for children who normally attend school.
Region: Regions of Australia are classified according to the Australian Bureau of Statistics Australian Statistical Geography Standard (ASGS), July 2011. This classification divides each state and territory into several regions on the basis of their relative access to services.
Service: Child care services are approved by the Australian Government to receive CCS on behalf of families. Most Centre Based Day Care, Family Day Care, Before and After School Hours Care services and some In Home Care services are approved child care services. The total number of services refers to the number of services that were active during the quarter, that is, they had at least one record of child care attendance in the quarter.