Higher educational attainment is associated with greater asset wealth.
On this page:
It is commonly understood that education improves living standards and national prosperity.[1] Money may not buy happiness, but it is the main mechanism individuals have to achieve a higher standard of living and economic-wellbeing.[2]
Income and wealth are two essential, and complementary, components of economic well-being. While income supports spending in the short term, wealth is a ‘stock’ concept: it refers to the value of accumulated assets.[3] The distribution of wealth amongst the population is typically more unequal than income. According to the Australian Household Income and Wealth 2015-16, the wealthiest ten per cent of Australian households held almost half of total household wealth. Wealth can be used to generate income and may allow people to more easily borrow money, leading to further wealth accumulation.[4]
There is a well-established link between education and income (see Income fact-sheet) but, what about wealth?
Using data from the same ABS Survey of Income and Housing 2015-16 our analysis shows a strong relationship between an individual-level measure of asset wealth[5] at a point in time and their educational attainment: personal wealth increases with higher levels of educational attainment. This trend holds even after controlling for potential confounding variables such as age, income, gender, occupation, and household composition.
As shown in Figure 1, in 2015-16, the median[6] asset wealth of individuals with a Postgraduate qualification was three times greater than for individuals whose highest educational attainment was Year 11 and below.
There is also a relationship between educational attainment and more diverse sources of wealth. Individuals with higher educational attainment tended be less reliant on a single asset with higher shares of wealth coming from superannuation, shares and other sources such as trusts (Figure 2).
There is however, no guarantee that more education will lead to more wealth. While wealth tends to be distributed unevenly between educational qualification levels, there is also a great deal of wealth inequality observed within a given qualification level (data not shown). This is most likely because wealth is accumulated over a person’s lifetime. Wealth creation is also associated with a person’s socio-economic and family background, and other factors such as their lifestyle choices and financial literacy.
Figure 1. Median asset wealth of 30-64 year-olds, by educational attainment, 2015-16
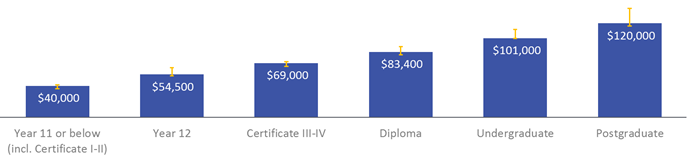
Source: Household Income and Wealth, 2015-16 (ABS cat.no. 6523.0)
Notes: 1) Asset wealth is the total of individual assets calculated as the balance of superannuation, value of accounts held with financial institutions, value of shares, value of trusts, debentures and bonds, loans to persons not in the same household, other financial investments, and silent partnerships. Wealth items not collected to individual level, e.g. to household level, were not included. 2) Medians were calculated by ranking all individuals within a qualification level in terms of their wealth, from lowest to highest. Statistical significance was tested using a semi-logarithmic linear regression model (ANOVA, education vs. null model: F = 63, d.f. = 5, p<0.001). Error bars are 95 per cent confidence intervals.
Figure 2. Proportion of 30-64 year-old persons with selected sources of asset wealth, by educational attainment, 2015-16
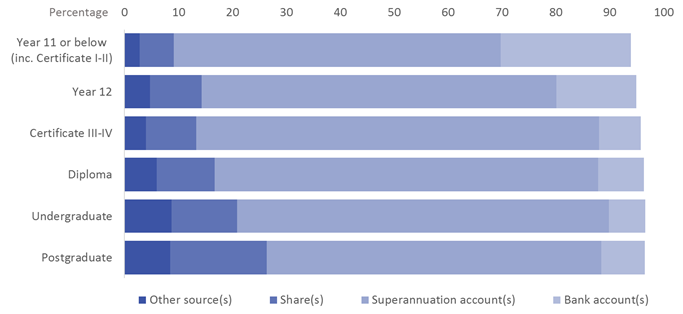
Source: Household Income and Wealth, 2015-16 (ABS cat.no. 6523.0)
Notes: Totals do not add to 100 per cent because some people did not report any of the above sources of wealth. Statistical significance was tested using a generalised linear model (logit) regression (Likelihood ratio test, education vs. null model: χ2 = 33, d.f. = 5, p < 0.001).
Data and Methodology
This paper uses data from the ABS’ Household Income and Wealth, 2015-16 (cat. no. 6523.0) where persons were aged 30 to 64 years (inclusive), resided in Australia and were not currently studying (n=17,639). To control for confounding factors, randomised control trials were simulated by finding groups of statistically identical individuals across the following covariates; age, gender, income, full-time/part-time work-status, combined family income, remoteness, main English-speaking country of birth and family type (coupled or single person with or without dependent children)(n=2,692). Significance was tested using regression on the matched sub-populations. This method provides the strongest possible evidence of cause and effect in cross-sectional data.
[1] OECD (2018a) Education at a Glance 2018: OECD Indicators, OECD Publishing, Paris, http://doi.org/10.1787/eag-2018-en
[2] OECD (2017) How’s Life? 2017: Measuring Well-being, OECD Publishing, Paris, https://doi.org/10.1787/how_life-2017-en
[3] OECD (2013) OECD Framework for Statistics on the Distribution of Household Income, Consumption and Wealth, OECD Publishing, Paris, https://doi.org/10.1787/9789264194830-en
[4] OECD (2018b), The Role and Design of Net Wealth Taxes in the OECD, OECD Tax Policy Studies, No. 26, OECD Publishing, Paris, https://doi.org/10.1787/9789264290303-en
[5] Defined here as the value of an individual’s bank accounts, superannuation, shares, debentures and bonds, loans to persons, share in a trust or silent partnership, and other financial investments.
[6] Compared to the mean, the median is a more stable measure when a distribution of values is skewed, as in the case of wealth.