This paper provides evidence of the broad private and social impacts of education and training.
On this page:
There have been decades of international qualitative and quantitative research that demonstrate the positive benefits of education. Additional educational attainment develops higher skills, leading to higher rates of employment, higher productivity and higher lifetime earnings for individuals.[1]
The primary argument in justifying government investment in education has historically been based on these positive labour market and economic returns.[2] However, education can also provide broader benefits for Australian society such as increased community engagement, improved family and child health and well-being, reduced tax burden for public services, a cleaner environment and reduced crime.[3],[4] Even after controlling for increases in income education still affects these social outcomes.[5]
While policy makers and researchers implicitly understand many of these impacts, this series of factsheets allows us to understand the size or weight of each of these impacts. This paper also shows how education and training policies act as a ‘social determinant’, influencing more than just the jobs and salaries that you can have over your working life. In this respect, education and training can be used as a complementary policy to address broader policy issues such as environmental conservation and preventative health (Table 1).
What we found
This is one of the first education studies to use the Multi-Agency Data Integration Project, a unique combination of Census, tax, welfare, health and education data.
We found that increasing levels of educational attainment were positively associated with community engagement, advocacy and volunteering, trust and tolerance, healthy behaviours, environmental conservation activities, employment and business management. These benefits contributed to improved income and wealth accumulation, reduced financial stress and reduced reliance on government support payments. By simulating randomised control trials, we provide the most robust evidence that these positive associations are causative.
The likelihood of being in the top ten per cent of all income earners in the country increases dramatically with educational attainment (Figure 1). Only four per cent of Australians aged 30-64[6] with Year 11 or below qualifications were in this category compared with 15 per cent of similarly aged Australians with a Bachelors and 28 per cent with a Doctoral degree.[7] The reverse trend is true for the bottom ten per cent of all incomes (Figure 1). These relationships hold after controlling for a wide range of demographic factors such as occupation, gender and labour force status.
Figure 1. Proportion of 30-64 year-olds in each income decile in Australia, by educational attainment, 2015-16
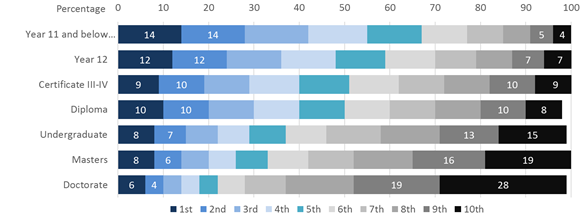
Source: Multi-Agency Data Integration Project customised data, 2016
Notes: Total income has been calculated as a combination of income from wages and salaries, government payments, business income and income from capital such as rents or shares for the 2015-16 financial year. Statistical significance was tested using a logit glm regression model (χ2=62,347; p<0.001; N=2,549,694) post exact matching on labour force status, occupation, age, gender, indigenous status, remoteness by state/territory, English-speaking country of birth and family composition (coupled or single person with or without dependent children). Only 1st, 2nd, 9th and 10th deciles are labelled. Year 11 and below includes Certificate I-II. Columns do not always total to 100 per cent due to rounding and incomplete data.
While the data showed a wide range of positive benefits from education and training, the news is not always positive or clear. A ledger of discontinued analysis is found below. For example, while we found evidence of more healthy behaviour, we also found that higher levels of educational attainment were associated with long working hours (>48 hours per week; Figure 2) and a higher likelihood of wearing glasses (see Appendix).
Figure 2. Proportion of 30-64 year-olds working in excess of 48 hours per week, by educational attainment, 2016
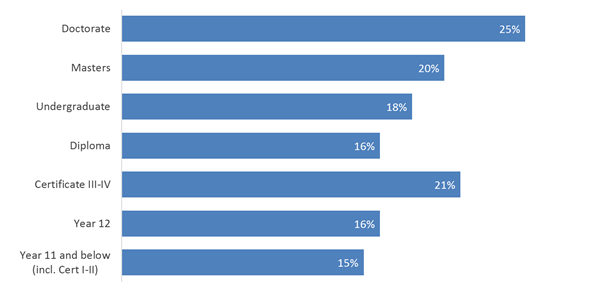
Source: MADIP customised data, 2016
Notes: No regression or propensity score matching technique was used for this chart.
A systematic approach using official data
Measuring the size and importance of social benefits arising from education and training is difficult and rarely undertaken in Australia.[8] Studies vary in the way they measure these private and public benefits and they are not often systematic about definitions, methods and attempts to prove a causal relationship. Though it is difficult to quantify, systematic analysis of these benefits can provide a justification for education and training policy and a basis for considering the contribution of education and training to preventative health and welfare issues.
This analysis was undertaken by the Data Integration and Analytics team within the Department of Education. We used official data from the Multiple Agency Data Integration Project hosted by the Australian Bureau of Statistics. The project consistently used standard definitions, timeframes and the same general techniques to measure the benefits of education and training. More importantly a consistent matching technique was applied to make sure that all results were robust and reliable.
Our data
A range of integrated data was used for this analysis, including the Census of Population and Housing and official surveys of Australian individuals or households where educational attainment was collected (see Table 1). Each of these datasets focus on different social issues. We also used the Multi-Agency Data Integration Project for the first time to take advantage of the combination of tax, health, education and welfare administrative data.
The benefit of using official statistics is that the definition and standards of educational attainment and other demographic information about individuals are similar across all data sets. While the majority of the survey datasets used are cross-sectional in nature they are also randomised and stratified samples of the Australian population. This provides an added reassurance that our results are representative.
Defining educational attainment
The level of schooling and highest non-school qualification is asked of people responding to most Australian Bureau of Statistics’ individual- or household-level surveys, such as the Census of Population and Housing. The highest qualification approach allowed us to look at a broad range of activities or outcomes in a consistent way.[9] This approach also has its limitations due to slight variations in the level of detail collected across data sets (see below). Wherever possible we compared the following groups:
- Year 11 and below (this includes Certificate I and II qualifications)
- Year 12
- Certificate III-IV
- Diploma [includes Advanced Diploma and Associate Degree]
- Undergraduate [includes Bachelor Degree, Graduate Certificate and Graduate Diploma]
- Postgraduate Masters, and
- Postgraduate Doctoral degree [Doctorate].
In some ABS surveys, people with Masters and Doctoral level qualifications were aggregated into a single ‘Postgraduate’ category.
Standard approach
Our standard approach to each national data set was to:
- Look for any evidence of a relationship between educational attainment and other survey questions
Each data set was generally filtered to include only those aged 30-64 and to exclude people currently studying. If we were able to find positive (or negative) relationships we then:
- Tested this relationship using a modified Propensity Score Matching (PSM) technique combined with a statistical test appropriate to the data.
The PSM technique simulates a randomised control trial by controlling for the broadest range of demographic characteristics available in the survey. Wherever possible we controlled for the Highest year of school completed, Main field of highest level of educational attainment, Socio-Economic Indexes for Areas (SEIFA), Weekly Household income, Personal gross weekly income, Gender, Remoteness, Number of dependent children in household, English as a second language, Age, Marital status, Indigenous status, Labour force status, Occupation, Long-term health condition, and Disability status. The use of these demographics varied by their availability in the survey (sometimes they were not asked) as well as the outcome variable in question, for example we did not control for income when income was an outcome variable.
Rather than using one educational attainment class as a control group we compared all of the above groups to each other using a novel statistical septuplet modification of propensity score matching. Using this matching technique to control for confounding variables we are able to provide the strongest possible statistical evidence of a causal relationship. If the relationship held up after controlling for these characteristics then we could be sure that the results were at least robust and reliable and at most indicated a causal effect of education. The results were then:
3. Summarised in a series of factsheets.
- Employment and income support – higher educational attainment is associated with higher labour force participation, higher likelihood of employment and reduced use of income support.
- Income – higher educational attainment leads to higher total income, more diverse sources of income and reduced reliance on the aged pension.
- Wealth – higher educational attainment is associated with greater wealth.
- Financial stress – higher educational attainment is associated with lower financial stress.
- Healthy behaviour – higher educational attainment leads to more healthy behaviour including never smoking, meeting exercise guidelines and responsible alcohol consumption.
- Civic engagement, tolerance and trust – higher educational attainment is associated with greater civic engagement, tolerance and trust.
- Voluntary work and donations – higher educational attainment is associated with a higher prevalence of charitable behaviour including voluntary work and making charitable gifts or donations.
- Environmental conservation and advocacy – higher educational attainment is associated with greater environmental conservation effort.
- Business management – higher educational attainment is associated with greater likelihood of occupying management jobs and more strategic management of business.
Our partners
We collaborated with the Australian Bureau of Statistics’ (ABS) National Centre for Education and Training Statistics, the Departments of Health and Social Services on this project. Our statistical method was reviewed by the ABS Methodology Division and our factsheets were reviewed by other relevant agencies and the ABS National Centre for Education and Training Statistics.
Limitations
Measurement challenges
The highest qualification approach has its limitations. It is a proxy measure of education and training. Since the highest level of schooling is often also collected in the same survey we could control for this in our matching algorithm. However, highest level of Vocational Education and Training (VET) is not asked separately. Our study was therefore not able to control for the compounding benefits of multiple non-school or tertiary qualifications on people’s prosperity. For example, if you have a Bachelor’s degree, and then complete a VET qualification which results in a higher income, this will not be recognised in the data. However, the fact that we also control for occupation should limit the impact of this problem.
We do not account for ability bias in the sample. Ability bias is where people’s tendency to reach higher levels of educational attainment is driven in part by high motivation and/or raw intelligence. These qualities in a person will also influence how easily they get better paying jobs or navigate the health system. While a number of researchers attempt to model upward ability biases of 10-20 per cent into estimates of outcomes, these are static in nature and are not consistent between outcome indicators.[10] Our approach is to acknowledge that ability bias exists and control for it as much as possible through measured demographic indicators that may partially control for motivation or ability.
Table 1. Australian Bureau of Statistics data sets investigated for this study
- Health
- Society and culture
- Environment
- Income and employment
- Management and Organisational Capabilities of Australian Business, 2015-16
- Survey of Income and Housing and Household Expenditure Survey for 2015-16
- Survey of Education & Work for 2016 to 18
- Survey of Qualifications & Work 2015
- Survey of Learning & Work 2010-11
- Survey of Work-Related Training & Adult Learning 2016-17
- Multiple uses
This study does not attempt to measure the cumulative total level of education experience (in years). This is difficult to do across Tertiary education, particularly in the VET sector. While we also could not easily measure the effect of on-the-job training, matching by age accounted for some cumulative work experience.
A common observation was that people with a Certificate III/IV appear to fare worse overall than Year 12 graduates particularly in social outcomes. However, Figure 3 shows that people with lower AQF-level VET qualifications did not have the same schooling profile as people with a higher education qualification. This is a sobering reminder that total years of education are not uniform within a qualification level let alone between them.
Figure 3: Highest reported level of schooling by highest reported level of educational attainment in the Australian population, not currently studying, aged 30-64, 2016
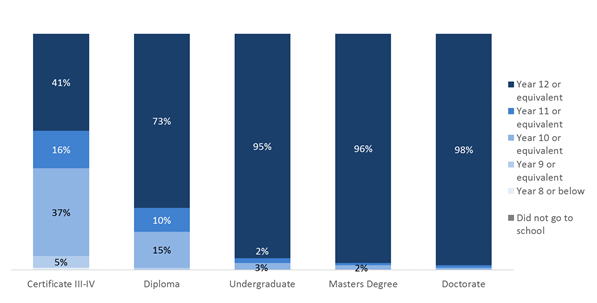
Source: Multi-Agency Data Integration Project 2016
Other challenges
Although it is widely acknowledged that child’s cognitive development begins well before they reach working or even school age, this project cannot say much about the compounding benefits of early childhood in the lead-up to schooling and working age.
Measures of subjective well-being, trust and tolerance can be subject to cross-cultural or social desirability bias. Only to a limited extent were we able to control for these biases through our matching technique.
Criminal justice micro-data was not available for this study, though we note that the relationship between crime, incarceration and recidivism rates and educational attainment have been found to be negative and significant by other researchers. In part this is because employment and income outcomes are poorer at lower levels of educational attainment.
Discontinued studies
As part of our stage-gate approach described above, a number of additional studies were undertaken but discontinued. These included some aspects of volunteering, caring, health, work and education, social activities, social security benefits and debt. There were numerous reasons for discontinuing the analyses including; no or weak statistical trends, unsuitable variables or sample size, the same or similar story being told in other analyses, and preferring to use MADIP rather than a sample survey. You can find out more in this Appendix.
[1] OECD(2018) Education at a Glance, OECD Publishing, Paris; Norton A, Cherastidtham I & Mackey W (2018) Mapping Australian higher education 2018, Grattan Institute.
[2] Lamb, S. and Huo, S. Counting the costs of lost opportunity in Australian education. Mitchell Institute report No. 02/2017. Mitchell Institute, Melbourne.
[3] Ibid; Behrman R & Stacey N (1997) The Social Benefits of Education, University of Michigan Press, Ann Arbor
[4] OECD(2018) Education at a Glance, OECD Publishing, Paris
[5] OECD (2013) What Are the Social Benefits of Education? Education Indicators in Focus No. 10, OECD Publishing, Paris
[6] 30-64 year olds who were not currently studying were chosen to allow a maximum HEAP to be attained
[7] Likelihood of being in the top ten percent of all total incomes: Doctoral degree (28 per cent), Masters (19 per cent), Undergraduate (including Graduate Diplomas and Certificates, and Honours) (15 per cent), Diploma (8 per cent), Certificate III-IV (9 per cent), Year 12 (7 per cent) and Year II and below (4 per cent). Source: Multi-Agency Data Integration Project 2016
[8] Chapman B & Lounkaew K (2015) Measuring the value of externalities from higher education, Higher Education 70: 767-785.
[9] We followed the ranking system set out in ABS (2014) Education Variables, June 2014, cat. no. 1246.0 and following the Australian Qualifications Framework.
[10] Schuck, B., & Steiber, N. (2018). Does intergenerational educational mobility shape the well-being of young europeans? Evidence from the European Social Survey. Social indicators research, 139(3), 1237-1255.